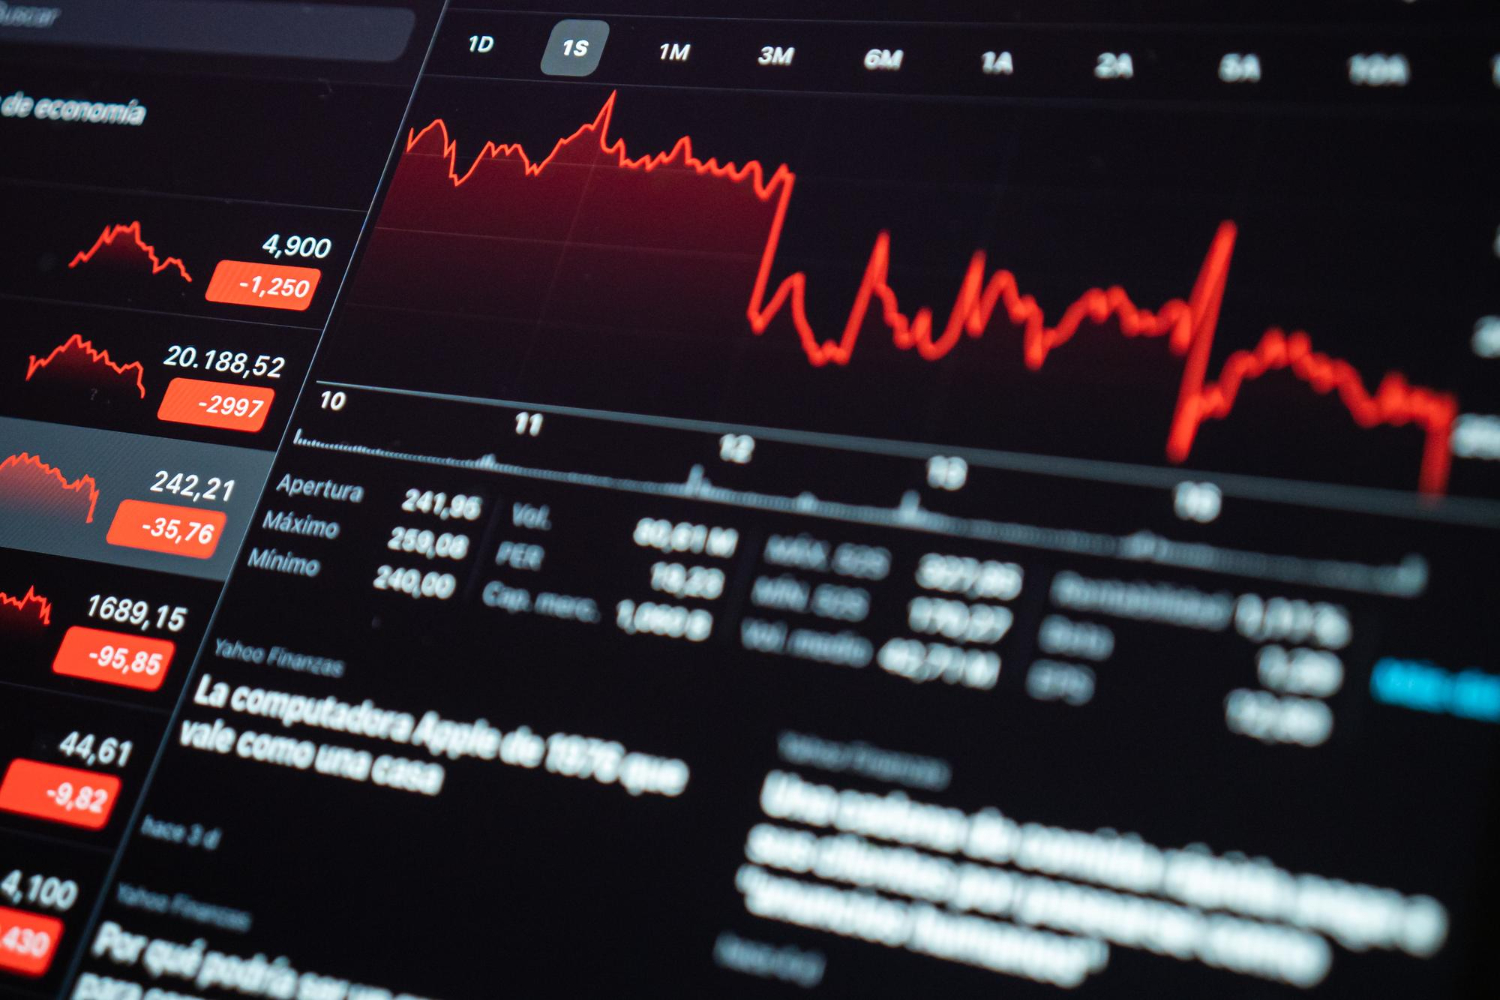
A deep market represents a dynamic and robust trading environment characterized by ample liquidity and a substantial volume of orders at various price levels. In such a market, there is a significant presence of both buy and sell orders, reflecting active participation from traders and investors.
The depth market offers a glimpse into the underlying supply and demand dynamics of a particular asset, providing insights into potential price movements and market sentiment. A deep market fosters transparency, stability, and efficient price discovery, enabling traders to execute orders with minimal impact on prices. Traders and investors often seek out deep markets for their ability to offer better opportunities for executing trades, managing risk, and making well-informed decisions in a market that reflects a balanced interplay between buyers and sellers.
What Is Depth of Market (DOM)?
Depth of Market (DOM), also known as the Order Book or Level 2 Market Data, is a real-time display of all the buy and sell orders waiting to be executed for a particular asset or security in a financial market. The DOM provides a comprehensive view of the supply and demand dynamics at different price levels, offering traders valuable insights into market liquidity and potential price movements.
In the DOM, you’ll typically see two columns: the “bid” side and the “ask” side. Each side represents the orders from traders looking to either buy or sell the asset. Here’s how it works:
- Bid Side: On the left-hand side of the DOM, you’ll find the bids, which represent the prices at which traders are willing to purchase the asset. Bids are usually listed in descending order, with the highest bid price at the top. The quantity of the asset traders are willing to buy at each price level is also displayed.
- Ask Side: On the right-hand side of the DOM, you’ll find the asks, which represent the prices at which traders are willing to sell the asset. Asks are usually listed in ascending order, with the lowest ask price at the top. Like bids, the quantity of the asset available for sale at each price level is shown.
The depth of the market refers to the number of orders and the total volume of assets available at each price level. A deep market indicates substantial trading interest and liquidity, while a shallow market suggests lower activity and potentially greater price volatility.
Traders use DOM to:
Identify Support and Resistance Levels: Clusters of bids and asks can indicate potential support and resistance levels, respectively.
- Gauge Market Sentiment: The balance between bids and asks can provide insights into market sentiment.
- Detect Order Imbalances: Differences between bid and ask quantities can hint at potential price movements.
- Make Informed Trading Decisions: Traders analyze DOM to make strategic decisions on entering and exiting positions.
- Evaluate Market Liquidity: DOM helps assess how easily orders can be executed without impacting the price.
DOM is a crucial tool for professional traders, especially those engaged in high-frequency trading and other short-term strategies. It offers a more detailed view of market activity beyond the traditional price charts, allowing traders to respond to real-time changes in supply and demand.
Deep Market: What it means
A “deep market” refers to a market with substantial liquidity and a significant volume of orders available at various price levels. In a deep market, there is a robust presence of both buy and sell orders, creating a balanced and active trading environment. This depth of orders signifies a high level of interest and participation from traders and investors.
Here’s what a deep market implies and why it’s important:
- Abundant Orders: In a deep market, you’ll find a large number of buy orders (bids) and sell orders (asks) at various price levels. This indicates a healthy level of trading activity, with many participants willing to buy and sell the asset.
- Liquidity: Liquidity refers to how easily an asset can be bought or sold without causing significant price fluctuations. A deep market is synonymous with high liquidity, as there are ample orders available for execution. Traders can enter or exit positions without significantly affecting the asset’s price.
- Efficient Price Discovery: A deep market aids in efficient price discovery. The numerous bids and asks provide a comprehensive view of the supply and demand dynamics, helping traders understand the fair market value of the asset.
- Reduced Bid-Ask Spread: In a deep market, the bid-ask spread—the difference between the highest bid price and the lowest ask price—is often narrower. This means traders can buy at a price closer to the highest bid and sell at a price closer to the lowest ask, reducing transaction costs.
- Reduced Price Manipulation: A deep market is less susceptible to price manipulation. Manipulators have a harder time influencing prices significantly when there’s a broad range of orders.
- Increased Trading Opportunities: A deep market provides traders with more opportunities for executing orders, regardless of whether they’re buying or selling. This can lead to a higher frequency of trades and increased chances to capitalize on market movements.
- Stable Market Conditions: A deep market generally experiences more stable price movements because the presence of numerous orders helps absorb sudden spikes in buying or selling activity.
- Attracting Market Participants: A deep market attracts institutional investors, retail traders, and other participants seeking efficient trading conditions. It fosters a competitive trading environment that benefits all stakeholders.
Overall, a deep market is a sign of a healthy and vibrant trading ecosystem. It encourages transparency, fair pricing, and accessibility for a diverse range of participants. As a result, traders and investors can make more informed decisions and execute trades with greater confidence.
How Market Depth Works
Market depth works by providing a real-time view of the supply and demand for a particular asset in a financial market. It displays the buy and sell orders from traders at different price levels, allowing participants to gauge the current market sentiment and liquidity. Here’s how market depth works:
- Display of Buy and Sell Orders: Market depth data is typically presented in a table format known as the order book or depth of market (DOM). The buy side, also known as the bid side, lists the prices and quantities at which traders are willing to buy the asset. The sell side, or ask side, displays the prices and quantities at which traders are willing to sell the asset.
- Order Prioritization: Orders are usually prioritized based on price and time. The highest bid and lowest ask prices are at the top of their respective columns. Orders placed earlier are given priority over later orders at the same price level.
- Cumulative Volume: The cumulative volume of orders at each price level is often displayed. This helps traders assess the overall strength of demand and supply at various prices.
- Bid-Ask Spread: The difference between the highest bid price and the lowest ask price is known as the bid-ask spread. A narrow spread indicates high liquidity, while a wider spread suggests lower liquidity.
- Market Sentiment: Traders analyze market depth to gauge sentiment. If the buy side has higher volumes and prices are increasing, it might indicate bullish sentiment. Conversely, a stronger sell side could suggest bearish sentiment.
- Identifying Support and Resistance: Clusters of orders on the buy side can indicate potential support levels, while clusters on the sell side can indicate potential resistance levels.
- Order Flow Analysis: Monitoring changes in market depth can reveal shifts in order flow. An influx of new orders or significant changes in quantities may hint at changing market dynamics.
- Execution of Orders: When a market order is placed, it is executed against the available orders on the opposite side. For example, a market buy order is matched with the lowest ask price, and a market sell order is matched with the highest bid price.
- Impact on Price Movements: Large orders or a sudden influx of orders at a specific price level can influence short-term price movements.
- High-Frequency Trading: High-frequency traders use market depth data for rapid execution and to identify fleeting arbitrage opportunities.
Market depth data is valuable for traders looking to make informed decisions based on real-time supply and demand dynamics. By understanding how orders are stacked at different price levels, traders can anticipate potential price movements, assess market sentiment, and effectively manage their trading strategies.
Using Market Depth for Informed Trading Decisions
Market depth data, also known as the order book or DOM, provides traders with a wealth of information to make well-informed trading decisions. Here’s how you can effectively use market depth for trading:
- Identify Support and Resistance Levels: Analyze clusters of buy (bid) and sell (ask) orders to identify potential support and resistance levels. Strong buy orders might indicate a price floor, while significant sell orders could signal a price ceiling.
- Gauge Market Sentiment: Compare the strength and distribution of bids and asks to assess market sentiment. A higher concentration of bids suggests bullish sentiment, while a higher concentration of asks may indicate bearish sentiment.
- Confirm Price Movements: Observe the order book to confirm price movements. If the price is moving upwards and there’s a growing concentration of bids, it could validate the upward momentum.
- Detect Order Imbalances: Look for order imbalances where one side significantly outweighs the other. This might suggest potential price movements as supply and demand dynamics shift.
- Choose Entry and Exit Points: Set entry and exit points based on the bid-ask spread and clusters of orders. You might consider entering near a strong support level or exiting near a resistance level.
- Monitor Large Orders: Keep an eye on large orders that can influence short-term price movements. A large market order can quickly deplete available orders on the opposite side, causing price fluctuations.
- Assess Liquidity: Evaluate the volume of orders at different price levels to gauge liquidity. A deeper market with higher volumes suggests better liquidity and reduced risk of slippage.
- Consider Order Size: If you’re trading with larger positions, consider the size of orders available at your desired entry and exit points. Larger orders might require splitting to avoid impacting the price.
- Watch for Rapid Changes: Monitor changes in the order book for sudden shifts in order flow. A quick influx of new orders might indicate breaking news or changing market sentiment.
- Intraday Trading: Intraday traders can benefit from market depth by identifying short-term price movements and executing quick trades based on order book data.
- Risk Management: Use market depth to manage risk. For instance, avoid entering trades when there’s limited liquidity or significant spreads.
- Combine with Technical Analysis: Integrate market depth analysis with technical indicators and chart patterns for a comprehensive trading strategy.
Remember that market depth is just one tool in your trading toolkit. While it provides valuable insights, it’s essential to use it in conjunction with other forms of analysis and to adapt your strategies based on changing market conditions. Regularly updating your understanding of market depth can help you become a more successful and adaptive trader.


